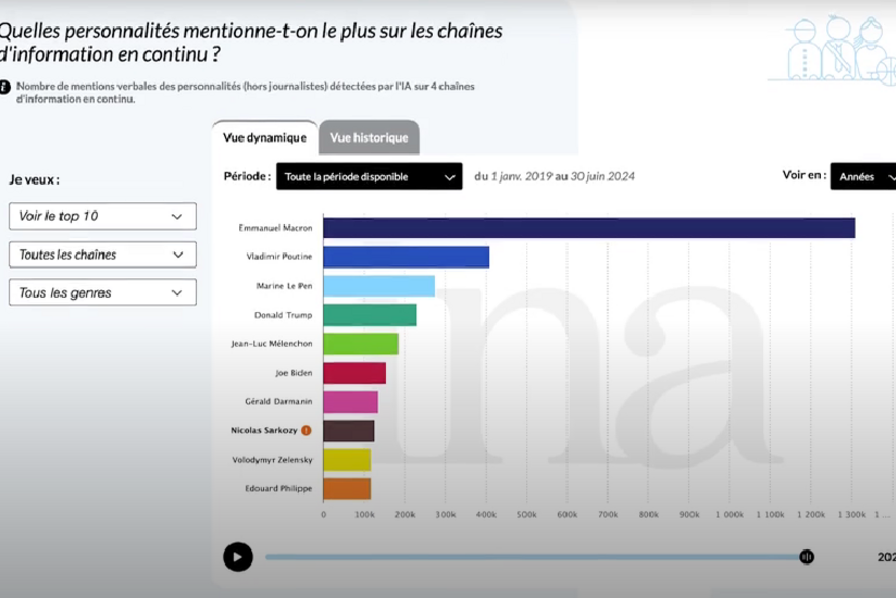
The National Audiovisual Institute dives into the pool of artificial intelligence. The Institute was determined to shed light on more than 27 million hours of stored and archived television and radio documents, captured from 184 channels, and the Institute resorted to artificial intelligence tools to achieve this. More specifically, it is about providing another reading network for these media, particularly through interactive graphics and maps.
“Easily accessible thanks to data visualization, the platform highlights key statistical trends in media and society with an approach that is both transparent and educational.” INA comments. The audience INA targets is broad: general public, journalists, experts or researchers, the platform is designed for everyone. “For example, an economics student who wants to know about media coverage of the term ‘deflation’ on morning radio shows will be able to find some answers on a selection of the channels you have selected.”“, gives INA as an example.
Artificial Intelligence, the key to data visualization
Of these 27 million hours captured, a portion has already been processed by AI tools. INA chose Whisper for transcription and TextRazor for named entity recognition. Added to this is InaSpeechSegmenter, a tool developed internally by INA’s Data and Technology Department for voice classification. By combining these three tools, NIT can exploit its data lake to extract its own popular reading network built around several themes: “Characters”, “Places”, “Words and Themes”, “Women and Men”.
After the final verification step, the data becomes available in a more visible way on the data.ina website. Behind the scenes, the INA reveals that a certain number of tests are being carried out. First, there is a comparison between the processing of television and radio clocks performed by artificial intelligence and that performed by humans to obtain a level of confidence in artificial intelligence tools. Next, automatic processing checks are performed, in particular to ensure the operation of processing flows and to detect quantitative inconsistencies. Likewise, relevance is judged in order to detect bias and inform users when such biases are demonstrated.
Updated every six months
In total, about a hundred people representing about ten professions contributed to the creation of this site: data analysts, data scientists, data engineers, infrastructure engineers, etc. If INA is currently launching its platform with just over five years of data – collected between January 2019 and the end of June 2024 – it plans to update it every six months with new data. “With each update, the site will benefit from the latest data, with greater historical depth than ever before,” The institute confirms. Thus, it ensures that processing and data quality checks are performed regularly.


